Vaccines Are Taking an Average of 5 Months to Kill People
By Steve Kirsch
The CDC has been hiding the Social Security Administration death master file. I got it from a whistleblower. This shows deaths are taking 5 months from the jab to happen. This is why it’s hard to see.
Note: This article was updated on Sep 4 to incorporate the confirmation with the UK data and on Sept 5 to incorporate Tim Ellison’s work.
The key point is this:
The UK data shows statistical proof of causality of deaths (p<.001): the vaccine doses track with the excess deaths 23 weeks later. Dose dependency is key to showing causality. If no one can explain this, the precautionary principle of medicine requires any ethical society to halt the vaccines now.
Executive Summary
Many people assumed the vaccine kills you quickly (in the first two weeks) because that’s when people notice the association and report it to VAERS. This is still true; it does kill some people quickly: half of the deaths reported in VAERS are in the first few weeks.
But the keywords are “reported in VAERS.” It turns out that if we don’t have that restriction but are just wondering when most of the deaths after COVID vaccination happen, the answer is different.
Thanks to a helper who works at HHS, we can now clearly see that most of the deaths from the vaccine are happening an average of 5 months from the last dose. That is for the second dose; it may be getting shorter the more shots you get but there are arguments both ways (since there can be survivor bias). Using data from the UK, we can see more clearly that the delay time is around 23 weeks (so a bit more than 5 weeks). We’ll dive into that shortly.
This delay explains why the life insurance companies got off-the-charts all-cause mortality peaks for people under 60 in Q3 and Q4 rather than right after the shots rolled out.
The five month delay is also consistent with death reports where people are developing new aggressive cancers that are killing them over a 4 to 6 month period.
The 5 month death delay was also confirmed using only European data. That analysis was posted Aug 11, but I learned about it after I wrote this post.
So when you hear of a death from stroke, cardiac arrest, heart attack, cancer, and suicide that is happening around 5 months after vaccination, it could very well be a vaccine-related death.
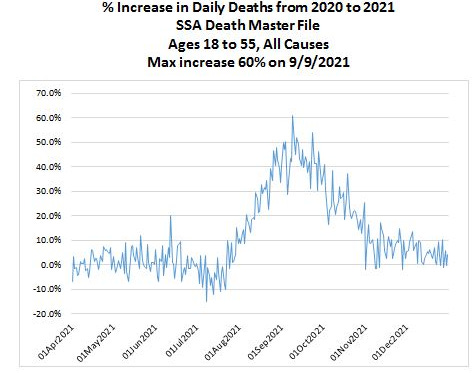
The data from the Social Security Administration death master file (ages 18 to 55)
I got this chart from a whistleblower who works for HHS. This is data you are not supposed to see. The mortality increase (60% at peak) is huge. That sort of increase can only be caused by something novel that affected massive numbers of people.
There is only one possibility that fits that: the COVID vaccine.
The peak is September 9, 2021.
Daily vaccine doses administered in the US
The peak is April 12, 2021.

Occam’s razor
The most obvious conclusion is that the vaccine takes an average of 5 months to kill people after the second dose.
The second peak in December 2021 will result in life insurance companies having spikes in Q1 and Q2 of 2022.
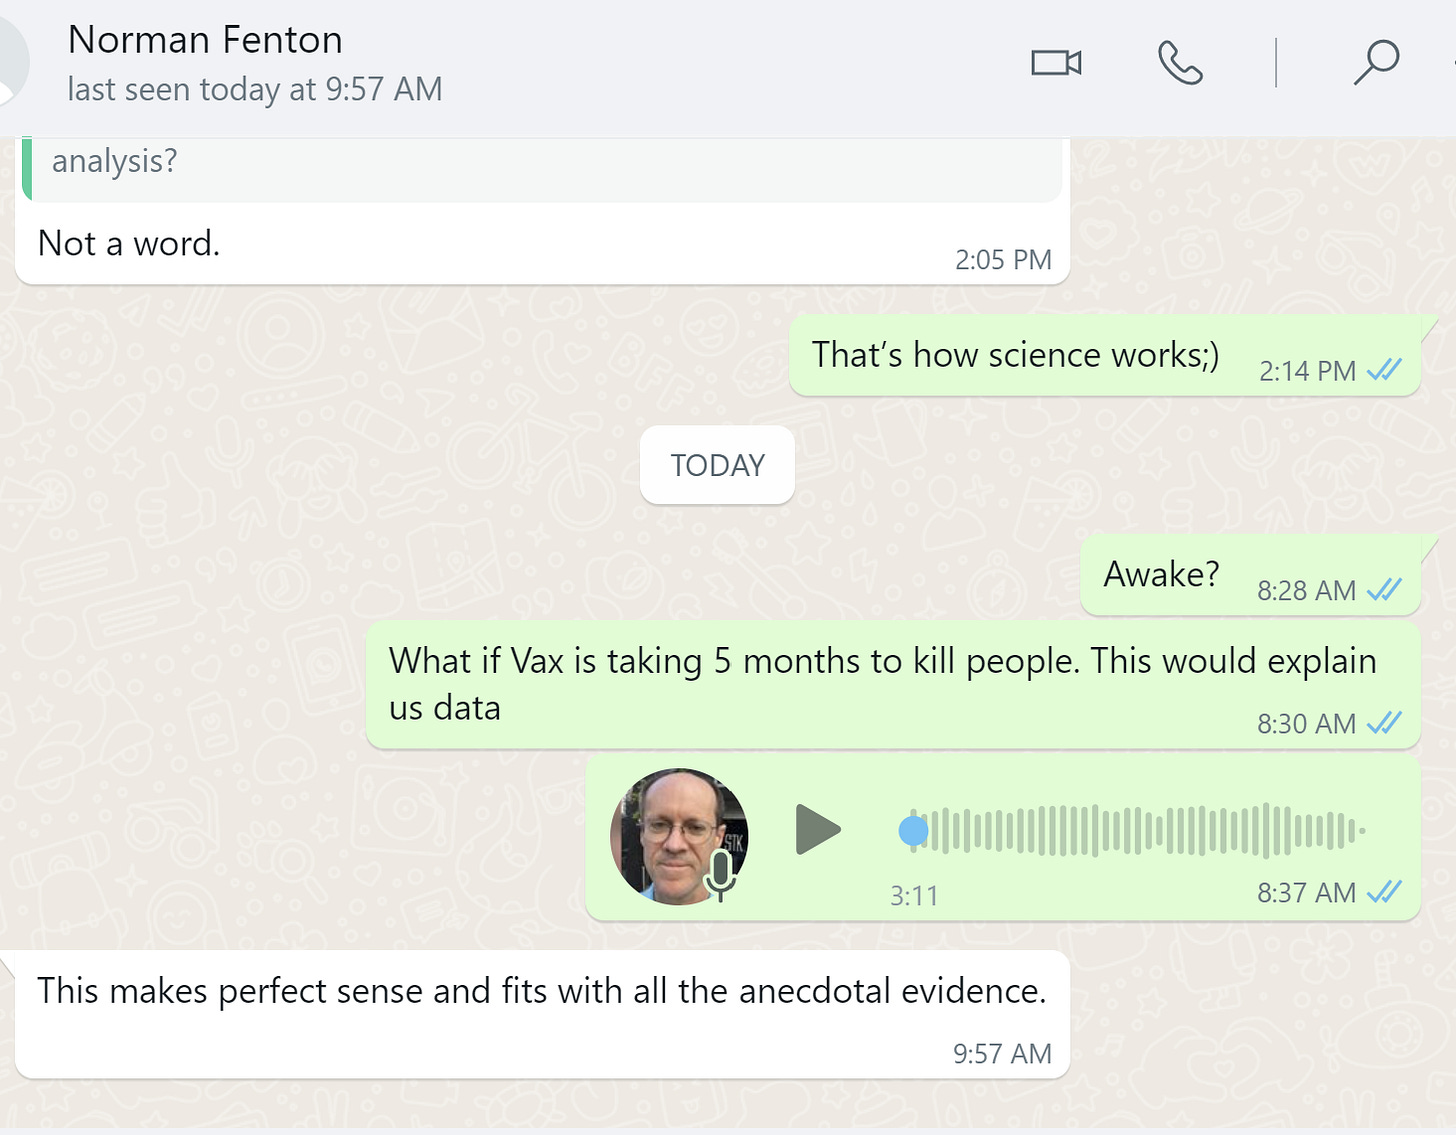
Here’s what UK Professor Norman Fenton said
Another analysis using only European data found the exact same 5 month delay!
An analysis posted at Chris Martenson’s site found the same 5 month delay using different source data! That is really stunning. I had no idea when I wrote my article.
Here’s the reader comment pointing this out and here’s the comment on Peak Prosperity posted August 9, 2022 which was just a few weeks before I found the same thing from the US data.
Here’s the full text of that post
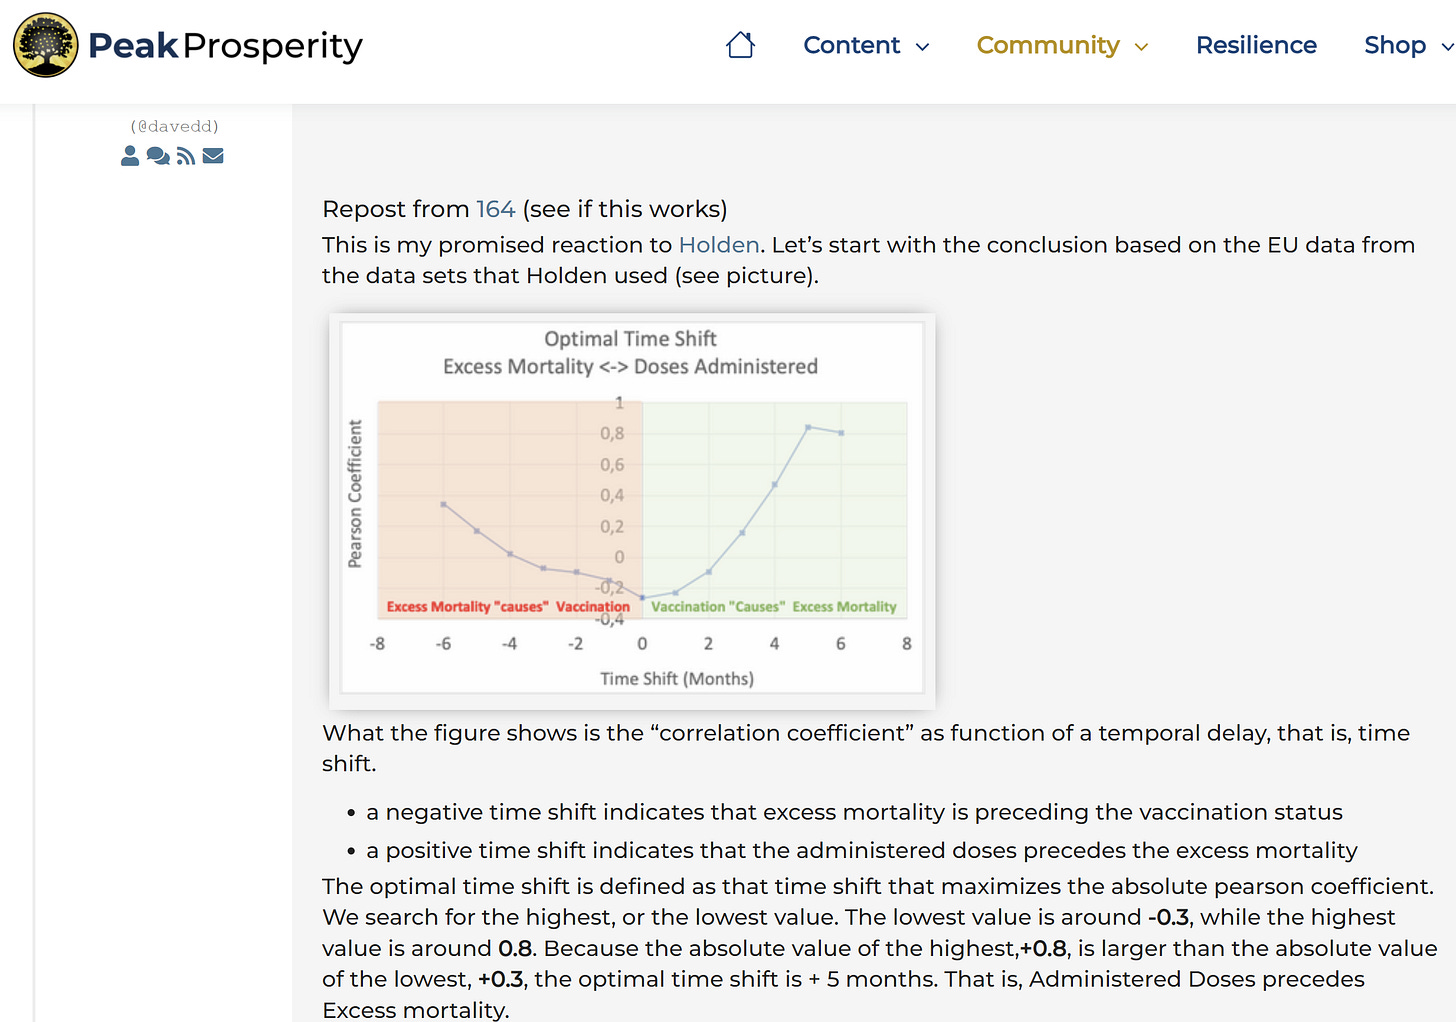
What the figure shows is the “correlation coefficient” as function of a temporal delay, that is, time shift.
- a negative time shift indicates that excess mortality is preceding the vaccination status
- a positive time shift indicates that the administered doses precedes the excess mortality
The optimal time shift is defined as that time shift that maximizes the absolute pearson coefficient. We search for the highest, or the lowest value. The lowest value is around -0.3, while the highest value is around 0.8. Because the absolute value of the highest,+0.8, is larger than the absolute value of the lowest, +0.3, the optimal time shift is + 5 months. That is, Administered Doses precedes Excess mortality.
As Holden indeed mentioned, we do find a negative relation also when there is no shift. However, the explanatory power of +0.8 is way larger than -0.3.
The reason why I used “causes” instead of causes is that there are several characteristics of causal relations. What we tested now is “temporal precedence”. An effect can not precede the cause, plus, a cause predicts the effect better than the cause predicts the effect.
In the cause of observational causality, another important aspect is that the cause should predict the effect better than the effect predicts itself. In this case we indeed find that Excess Mortality predicts itself poorly —of course, for a time delay equal to 0, it does predict itself, for all other time delays, it has little to no explanatory power—.
From this we can conclude that, based on the data sets used, Administered Doses do cause Excess Mortality.
Of course, our “brilliant experts” are still stuck in the 19th century wrt statistical methods. I do not expect that they will be able to explain the excess mortality with their current methods, simply because 5 months is a huge time delay, and because here is typically little knowledge of observational causal methods.
About the method
The method used is based on correlations. The current state-of-the-art is based on Information Theory, but that’s too out of the ordinary for layman, and even experts, so we better not go there. When I have time in a couple of weeks I might run the information theoretical causal analytics.
About the data
As mentioned, the data sets from Holden’s sources were used. We selected only EU countries, we did not differentiate between sexes and age groups. Finally we used monthly data due to time restrictions on my side (I simply do not have time to search for, or create weekly data sets for the excess mortality).
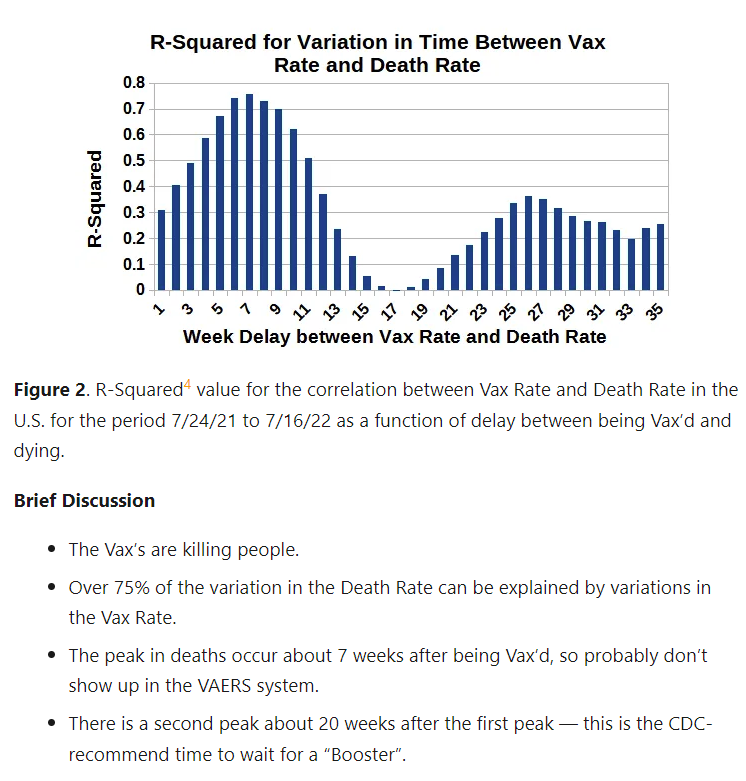
A third analysis shows a similar delay (Spiro P. Pantazatos, PhD)
The reaction time for Dose 1 is longer than Dose 1 and 2:
Click the graph to see the analysis detail.
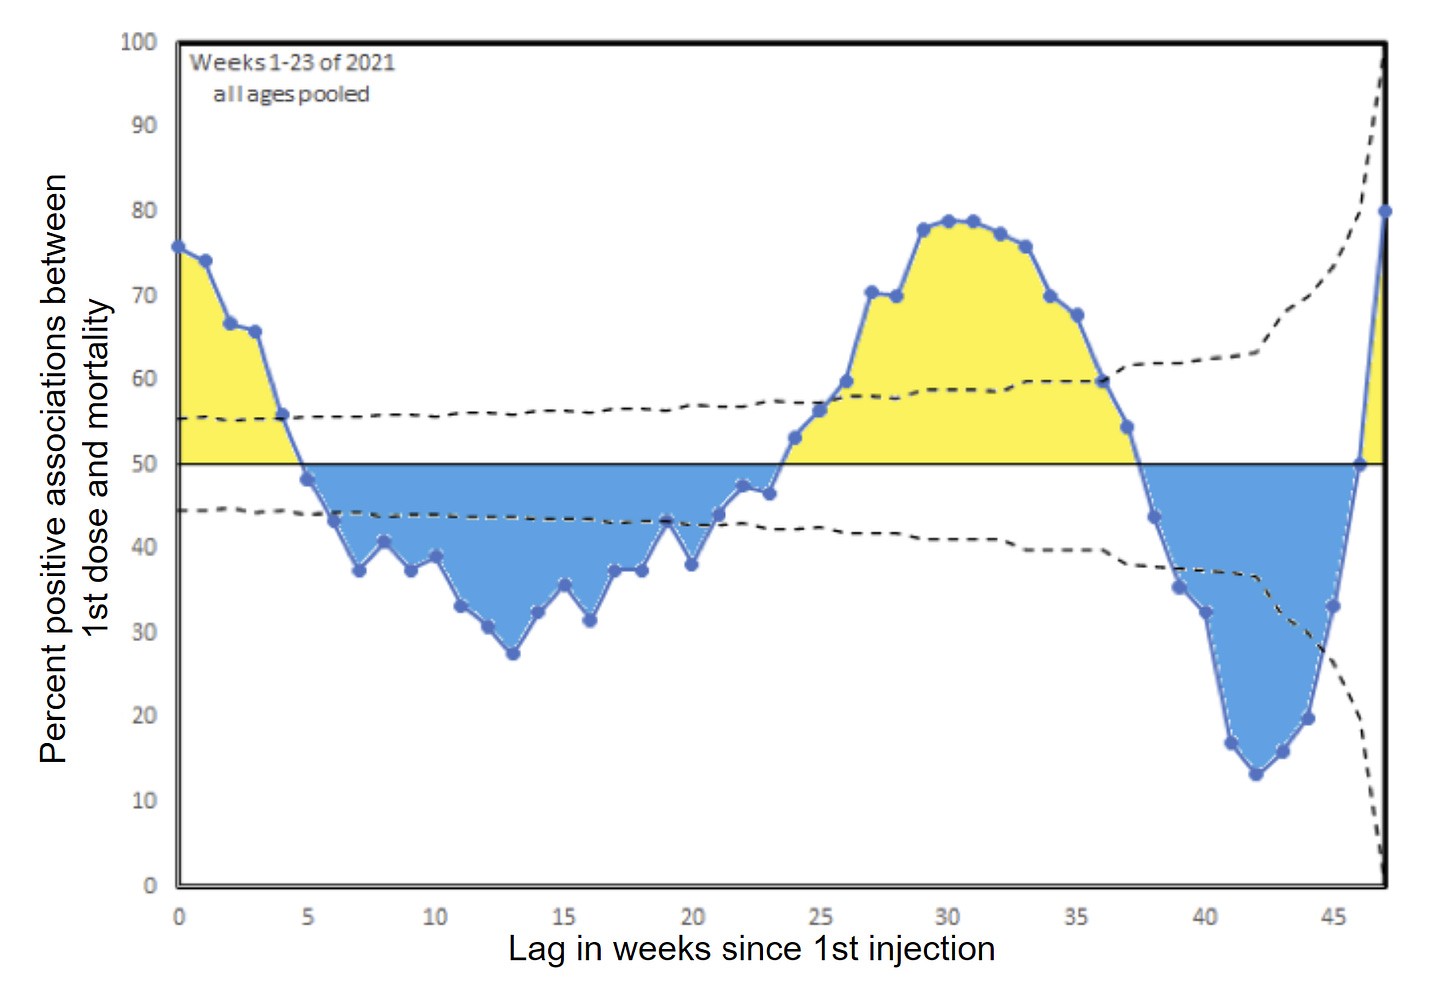
A fourth analysis uses UK data only and finds a 23 week lag time with very high statistical significance (John Dee)
This analysis posted in John Dee’s Almanac is the nail in the coffin for people claiming the vaccines don’t cause death.
What he found was that the number of COVID vaccine injections can explain a third of the non-COVID excess deaths 23 weeks later. That’s huge. That is causality. The p-value is p<.001.
Note that a p value of 0.1 is typically a max cutoff (for things that don’t really matter so much), p<0.05 is “normally” used, and p<0.01 when it really matters a great deal. See this article on p-values for details.
The precautionary principle of medicine says the vaccine is killing people. It should be stopped.
He writes:
The coefficient of determination drops out of the grill pan at r-square = 0.335. In plain English this means 33.5% of the variation we see in excess non-COVID death can be explained by variation in combined daily dosing at a lag of 23 weeks together with case detection rate at a lag of 2 weeks. Call that 34% and we have just over a third of excess deaths being explained by this combi boiler.
And includes this graph:

A fifth study finds a similar delay (Tim Ellison)
Tim Ellison finds two death peaks: at 7 weeks and 27 weeks post vaccine. Because the first week is 7 weeks out, the VAERS system is unlikely to see it because it is so far out.
One possible interpretation: the first peak is due to the first two doses and the second peak is due to getting the next booster. Food for thought. This may make some sense since the booster peak is lower (fewer people get the booster). Or it may just be that the vaccine has two-time constants of harm. Or it could be a combination of both!
The embalmer data gives more insights as to the cause of the double peak
I disagree with Tim about the booster.
Read this description of the embalmer data.
Those clots take a while to form and then kill you.
The vaccine has at least two major mechanisms of death. One has a short time constant and the other has a longer time constant. That’s why the embalmers didn’t notice these telltale clots until mid-2021.
An anecdote
This is interesting. It’s unlikely that there are example of both parents dying within 1 month of vax, but it’s not hard to find both parents dying around 5 months from vax:

The summer months hypothesis
Mathew Crawford speculated that the delay was the same in Europe and the US due to similar rollout schedules. He speculates that people are more active in summer and activity that raises your heart rate is more likely to trigger strokes and heart attacks in the vaccinated.
I agree that this may be a contributing factor, but I don’t know how much.
Could this be just “Delta”?
Delta started on July 1, 2021 and ended on December 15, 2021. So we’d expect more of a plateau rather than a sharp peak if it was Delta.
In addition, the insurance companies confirmed it wasn’t COVID that was causing the excess deaths.
And then we have plenty of stories of vaccine victims dying around 5 months after the shot.
And we have the emergency study in Israel showing a 25% increase in calls between January and May, 2021. What’s interesting is that the authors of the paper were not allowed access to the same emergency call data after May, 2021 (they asked and were denied). That’s a huge red flag. COVID doesn’t cause cardiac issues. And the drug companies are trying to get that paper retracted.
And now we have the disclosure that the Israeli Ministry of Health deliberately withheld vaccine safety data from the people of Israel. It seems the vaccine isn’t as safe as the told people. So when they found that out, they manipulated the data to make it look safe and released the manipulated report, something that is clearly illegal and unethical. The mainstream press refused to cover the story.
So the evidence seems more consistent with vaccine deaths than COVID deaths.
Alternate hypotheses
If someone has a better explanation for this data, I’d love to hear it.
It does appear from reading the comments that it makes sense to reader and explains what they personally observed.
If any fact checker wants to challenge me on this, you can use the Contact Form and let’s have a recorded conversation.
The CDC doesn’t want to talk about this. They also won’t tell us why they aren’t showing us this data.
For sure, the NY Times and rest of the mainstream media will ignore this and won’t ask any questions. Maybe Tucker Carlson will talk about it.
Implications for the Canadian doctor death data
Armed with this new knowledge, we should stop looking just for deaths proximate to the vaccine and look at the overall death rate in Canada of young doctors, e.g., doctors 50 and younger. What I found when I did that is that the number of young doctor deaths in Canada increased by a factor of 2.5X in 2021 vs. 2020 (15 deaths vs. 6). I’ve requested the data for earlier years to see how this compares
Summary
It was wrong to assume that most of the vaccine-related deaths were happening shortly after vaccination. Some are, but most are not. It’s just that they were easier to notice when there was temporal proximity to the jabs.

Original Source: https://stevekirsch.substack.com/p/this-one-graph-tells-you-everything